How to convey the structure of a complex system in an accessible way? How to offer entry points for people not familiar with such a system?
Diagrams are nice, but sometimes their extreme precision can be intimidating and inaccessible. Maybe what is missing in this precision is a metaphor, a lens from where to look at the different parts of the code.
When writing the documentation for the Padliography, a bookmarking tool relying on several different platforms, the need for a more narrative approach came up.
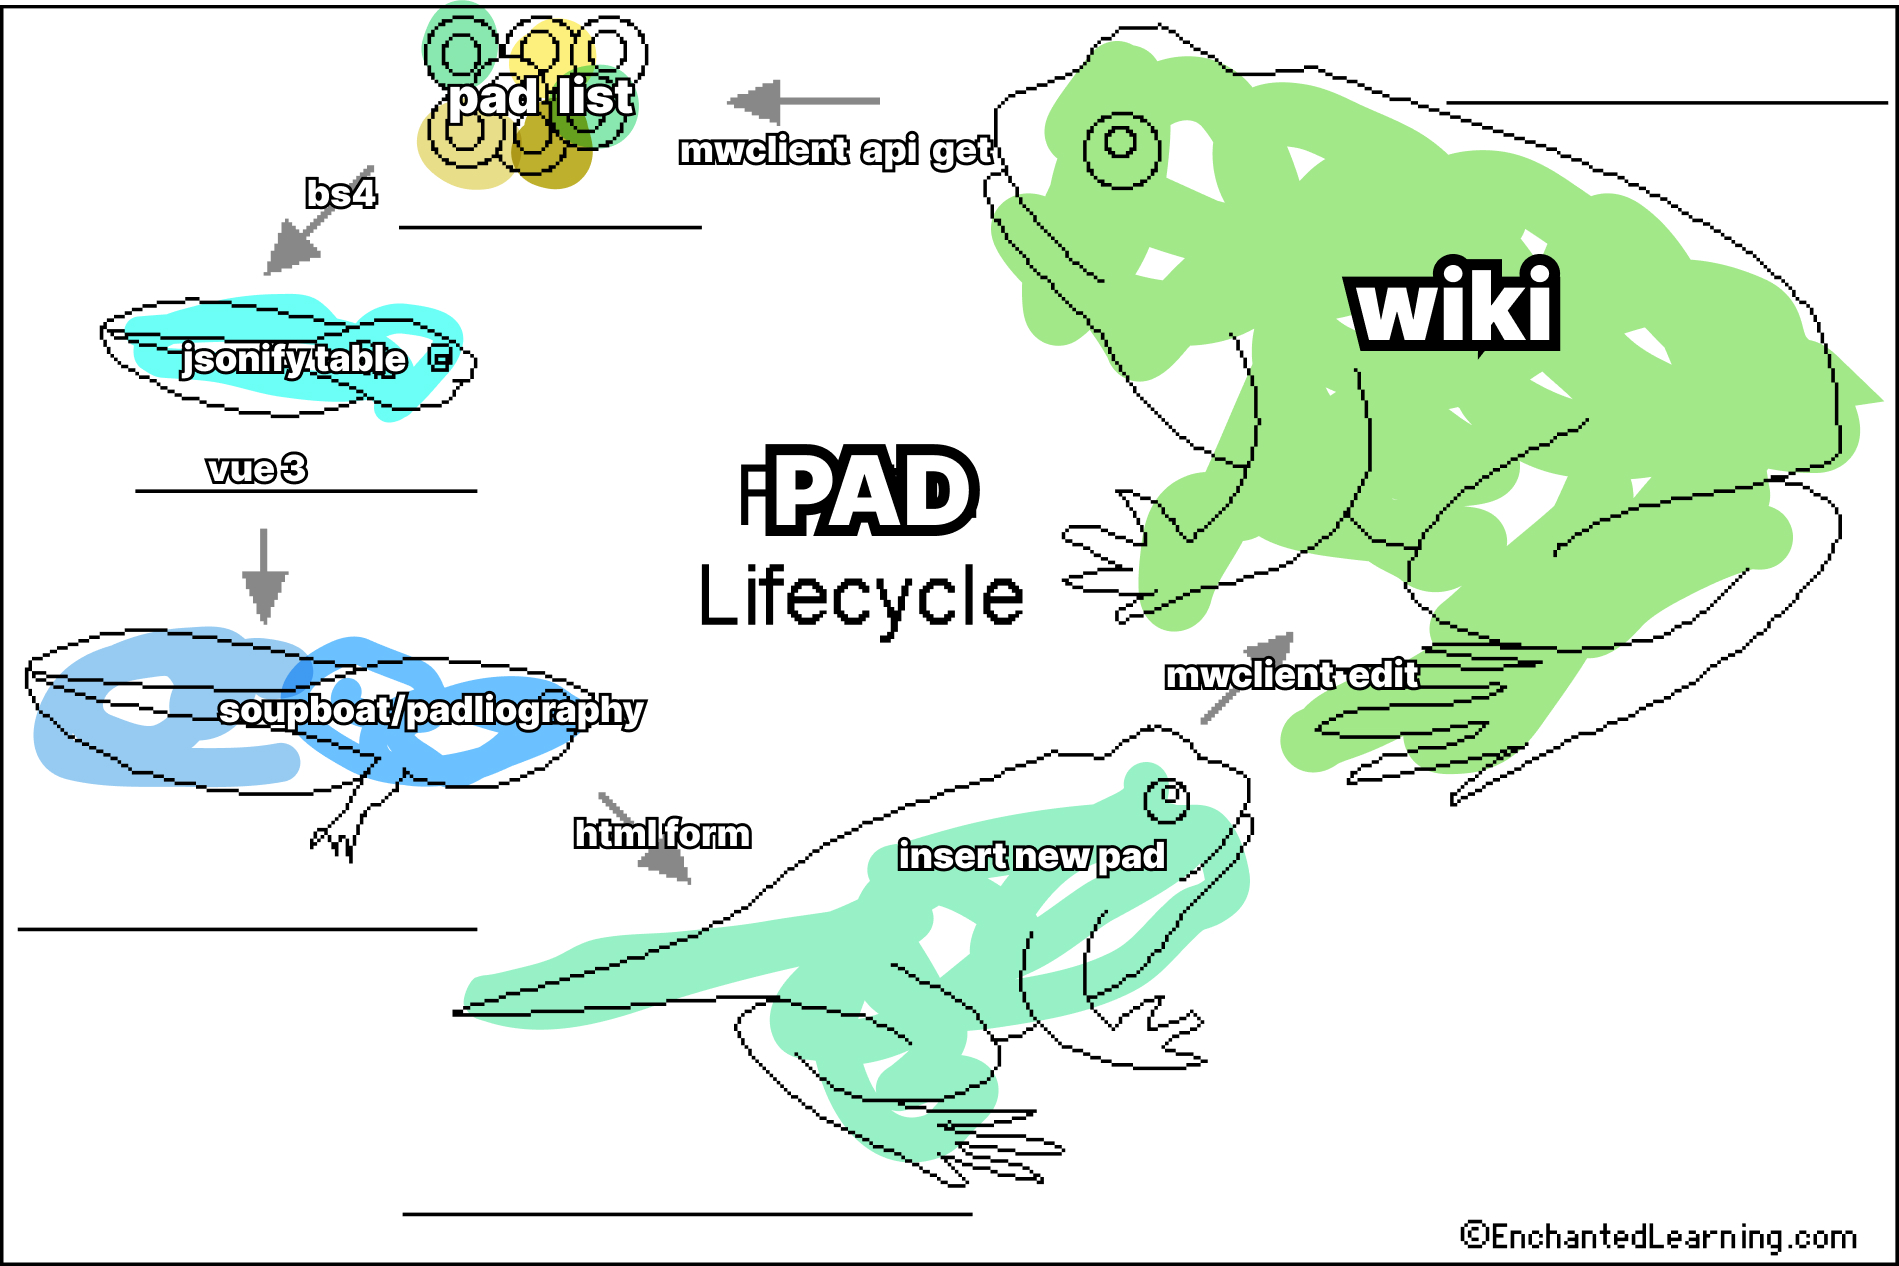
The process started searching for a familiar metaphor to grab for someone unfamiliar with the codebase and its surroundings. I figured out that the structure of the system was a circular process, hence I went for images such as lifecycles, environmental cycles, water cycles. The kind of educational pictures that you could find on an elementary school textbook, one with coloring pages.
Eventually found one about frogs that suited well with the nature of the Padliography, with every bookmarked link generating even more bookmarks.
In the end I think the result it's really effective: using an image let you be more precise and less scared of being precise. No worries of inserting the exact name of a specific library, even if it sounds alien to an external reader. The tadpoles will cover for it, acting as provisional mental placeholders in place of unkown piece of technology.